Intro to MotiveWave Volume Imprint Study
This official MotiveWave tutorial introduces the Volume Imprint study, one of the platform’s most powerful tools for visualizing volume distribution alongside market profile data. The nearly 50-minute session provides a thorough walkthrough of the feature’s capabilities, configuration options, and practical applications.
The Volume Imprint study displays volume data at each price level within each bar or time period, creating a detailed heatmap of where trading activity is concentrated. This is similar to footprint or cluster charts on other platforms, but with MotiveWave’s distinctive visual approach and customization options.
The presenter demonstrates how to configure the Volume Imprint display, including color gradient settings, volume threshold filters, and overlay options that allow you to combine the imprint data with traditional chart types or Market Profile views. The integration between the Volume Imprint and MotiveWave’s Market Profile tools is particularly powerful, as it allows traders to see both time-based and volume-based profiles simultaneously.
Practical applications covered include identifying absorption (where large volume is transacted without significant price movement), spotting initiative activity (where volume drives price directionally), and finding exhaustion points (where volume spikes at price extremes). These patterns, when identified within the context of Market Profile structure, provide high-probability trade signals.
This is a valuable resource for MotiveWave users and traders evaluating the platform for Market Profile and volume analysis. The depth of the Volume Imprint feature makes MotiveWave a strong contender for traders who prioritize detailed volume visualization in their market structure analysis.
Related Videos

Market Profile Guide to Day Types, Opening Types, Single Prints, Poor High/Low
A comprehensive guide covering Market Profile day types, opening types, single prints, poor highs and lows — essential concepts for classifying market behavior.
Watch video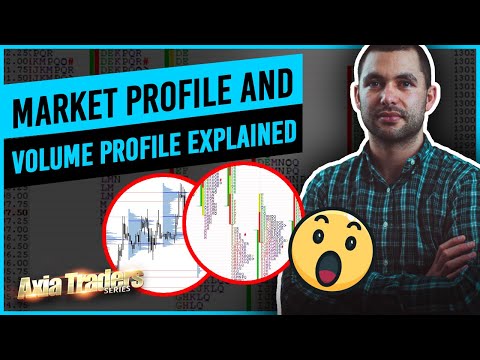
Market Profile vs Volume Profile: Beginner Tutorial
A beginner-friendly comparison of Market Profile and Volume Profile, explaining the key differences, strengths, and when to use each approach.
Watch video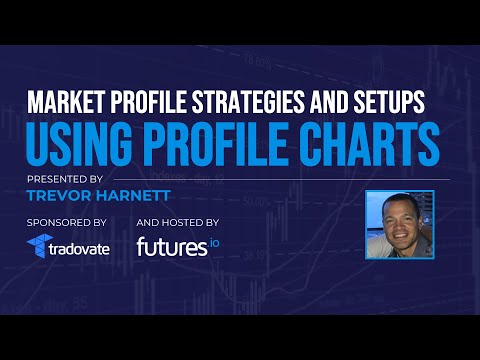
Market Profile Strategies: Trade Setups & Profit Targets Using TPO Profile Charts
Advanced Market Profile strategies covering specific trade setups, profit targets, and risk management using TPO Profile charts.
Watch video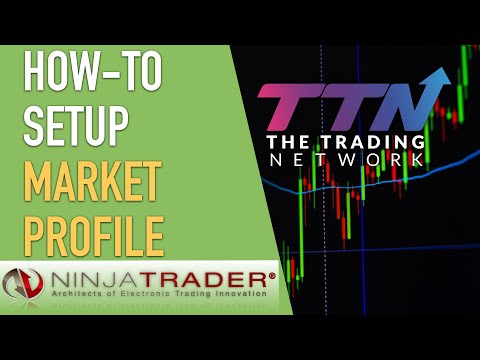
How to Setup Market Profile on NinjaTrader 8
An official NinjaTrader guide to setting up Market Profile charts on NinjaTrader 8, covering TPO configuration, display options, and value area settings.
Watch video