How to Set Up Market Profile or TPO in Sierra Chart
This official Sierra Chart tutorial walks through the complete process of setting up Market Profile (TPO) charts in one of the most powerful charting platforms available. Sierra Chart is a favorite among professional Market Profile traders for its flexibility and depth of configuration options.
The video covers the initial chart creation process, including how to select the TPO chart type, configure the time bracket duration (standard 30-minute periods), and set up the visual display options. The presenter explains each configuration parameter and its effect on the resulting profile, helping new Sierra Chart users understand what each setting controls.
Key configuration topics include setting up value area calculations (70% vs custom percentages), POC highlighting, initial balance display, and multi-day composite profiles. The video also covers color coding options that help distinguish between different time periods and structural elements like single prints and poor highs/lows.
Advanced display options are also covered, including how to overlay volume data on the TPO chart, how to configure split profiles for analyzing specific time ranges, and how to save chart templates for quick access to your preferred Market Profile configuration.
This is essential viewing for any trader who uses or plans to use Sierra Chart for Market Profile analysis. The platform’s extensive customization options can be overwhelming without proper guidance, and this video provides a clear path from a blank chart to a fully configured Market Profile workspace.
Related Videos

Market Profile Guide to Day Types, Opening Types, Single Prints, Poor High/Low
A comprehensive guide covering Market Profile day types, opening types, single prints, poor highs and lows — essential concepts for classifying market behavior.
Watch video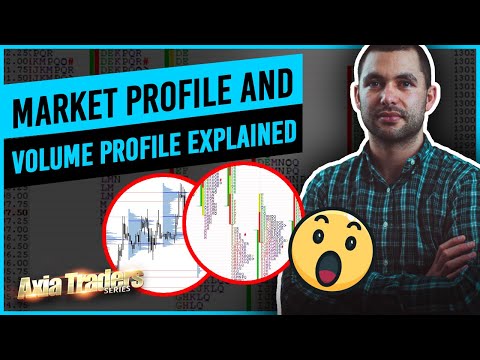
Market Profile vs Volume Profile: Beginner Tutorial
A beginner-friendly comparison of Market Profile and Volume Profile, explaining the key differences, strengths, and when to use each approach.
Watch video
Intro to MotiveWave Volume Imprint Study
An introduction to MotiveWave's Volume Imprint study, showing how to visualize volume distribution and market profile data for auction analysis.
Watch video
Market Profile Strategies: Trade Setups & Profit Targets Using TPO Profile Charts
Advanced Market Profile strategies covering specific trade setups, profit targets, and risk management using TPO Profile charts.
Watch video